Metaphors for Immersive Software Visualisation

“It matters what stories we tell to tell other stories with; it matters what descriptions describe descriptions; it matters what stories make worlds, what worlds make stories.” 1
Stories and Systems
Software visualisation make the intangible tangible. To do so, it uses metaphors which translate abstract and complex structures of code into graphical representation of entities and their relations. We create narrations through generating interactive environments; with the help of narrations we can talk about systems. The first system mentioned here is a software system, its patterns and anti-patterns. The second one is represented through the cultural techniques of VR and IT work, the techniques of cognitive capitalism – commercialism, digital labour or playbour (labour as a play) and creative expression – another “system” in need to discuss.
Descriptions
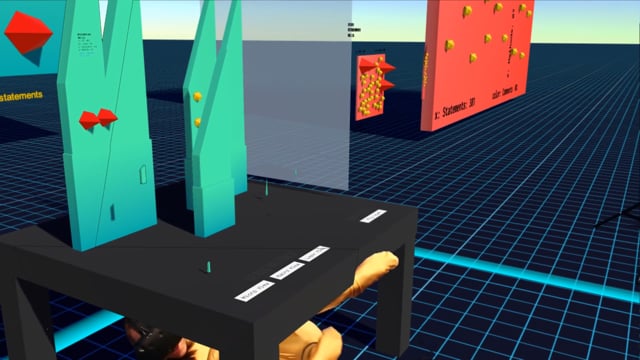
The metaphors (as models of VR environment) are based on the data from a software written in Java at HEC Software Development between 2015 – 2016 which has 23k lines of code, 325 files and 363 classes. Used data metrics about the system comes from SonarQube, an open source quality management platform, are implemented in C# as data meshes to Unity3D and developed to run on HTC Vive. Created virtual environment has three levels which concentrate on specific questions and goals that motivated the visualisation (download PDF version of the sketch).

Level 1: Metaphors for class metrics. Task: to identify anti-patterns.
Q: When, why and by whom was this part of code identified as a potential problem (a.k.a. smell)? How many smells, classes, LOC, statements and methods have a file? Playbour slogan: “Practice a method of climbing refactoring and fix couple bugs in your lunch break!”

Level 2: Metaphors for software architecture visualisation. Task: to show test coverage.
Q: How many unit tests have been written for each of the packages, how high is the test coverage for each tested file and which files have 0% coverage? Scroll through the source code in VR for a detailed view.
Level 3: Metaphors for software evolution. Task: to visualise the development of the software.
Q: What files have been changed since the previous snapshot, which metrics have been collected on which snapshots and what are the differences between them? The final outcome introduces software in a simplified and playable way, so that different users coming to the code later in its life can understand, memorize and discuss software structure and its evolution. Here we can talk about the potential of playbour in Virtual Reality for software refactoring or just for a general dissemination and support of programming education.
Worlds
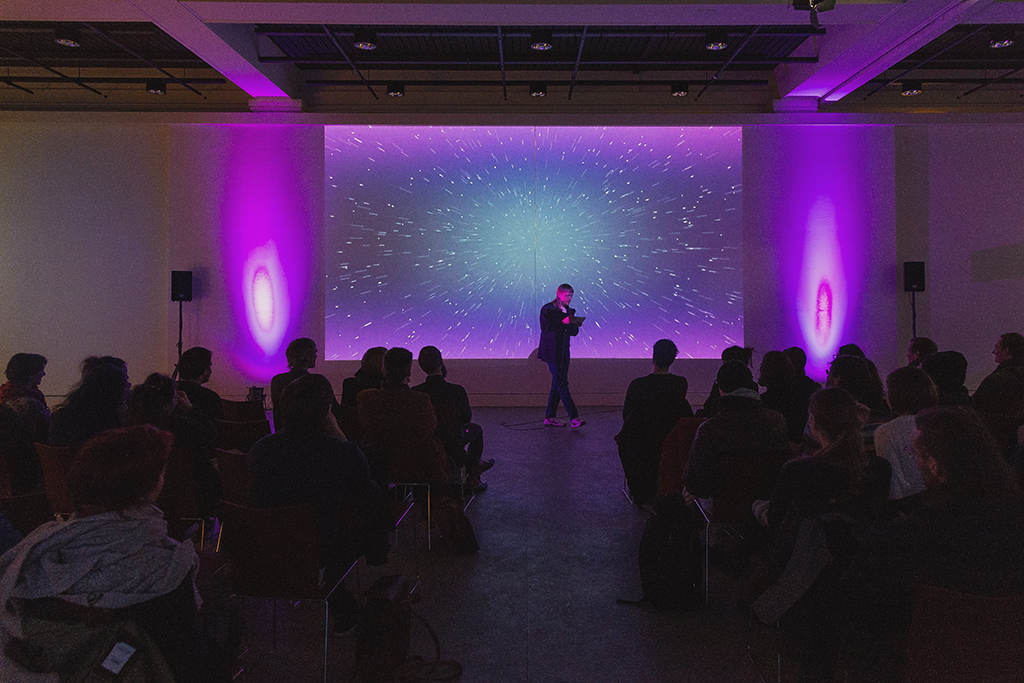
Visualisation, like any form of representation, always signify something outside the interpreted system. The application demo “SoftWorld” has also another level of signification, the staging of its presentation in form of “Innovation Show”. In this show, the audience is forced/carried through a group meditation in order to create a collective brain to be able to enter SoftWorld. All of the set phrases used in the intro of the live presentation (not included in video) are completely based on the real slogans of existing software engineering startups and technology trend agencies. Here, in the broader socio-technological sense, we can talk about commercialism, about the fascinating PR of VR (promo language of virtual reality and other new technologies) or discuss the material aspects of virtual and mixed-reality technologies (it is even more fascinating how invisible they tend to stay 2).
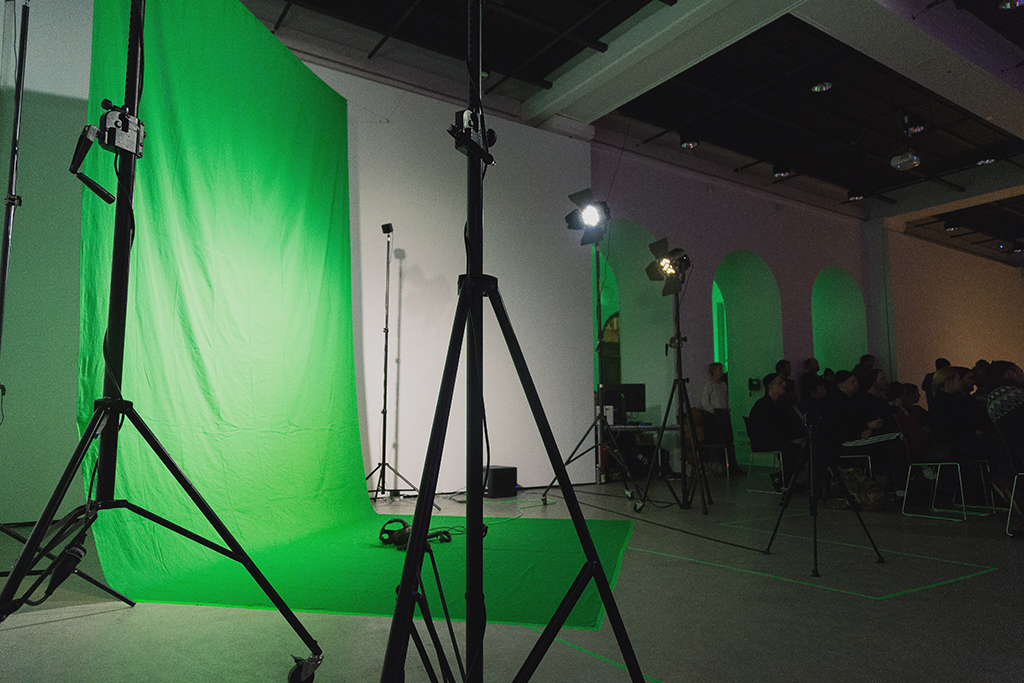 MA colloquium with real-time mixed realiy setup, Gallery Dechanatstraße, Bremen 2017.
Welcome to the SoftWorld – mixed reality video:
Files & Links Short master thesis
Documentation on the University of Bremen web. Research-blog on the topic of software visualisation in 3D and VR datavisualisation. Virtual Materialism – an “ongoing research” web page on the topic of philosophy of VR.
This work was performed in collaboration with HEC IT Solution Bremen. “Innovation Show intro” was greatly performed by Janis Fisch. Photos of the colloquium by Arnold Faud.
- 1. Quotation from: Haraway, D. 2016: Staying with the Trouble ↩
- 2. Think of the huge amount of data necessary to collect in order to generate interactive VR scenarios. Similarly to web where for clicking a button, the cursor position needs to be estimted, your body position and movement in the virtual environment need to be detected in order to generate immersive experience. This is where we see the embodied aspects of information in an almost trivial essence despite their complexity. Just read the licence agreement for use of some head mounted display software/ hardware and you will be immersed in the worlds of actual-virtual-economical-material situatedness of our everyday digital reality. ↩