How to Measure a Planet

How to Measure a Planet seeks to create imaginary topographies through the height difference of two places on the planet based on digital and analog data. In other words, the project is a method and a subsequent representation that metaphorically connects two points on the planet by means of topographic-related data. Essentially, it is a device that converts the collected data into a 2D plane drawing. The machine consists of three servomotors that translate digital information from collected data into a mechanical force that moves a pencil. Each arm is controlled by one of the following data: temperature, height, and pressure, all of which are related to the elevation of a given place.
Inspired by the extreme contrast between the two places where I have lived (Santiago –Bremen), I wondered about the ways in which a possible connection between them could appear. In other words, how the geographical differences of two particular territories can generate a metaphorical bridge, which may express these differences in perception of the places we inhabit.


How to make differences appear
Is it possible to connect two points on Earth based on their geographic characteristics? And more specifically, on their height differences? How can we create a conceptual crossover between technology, geography, and the way we perceive the places we inhabit? With this starting point, I began to think about a device that would help me to translate these landscape differences into a material state.
I started by using a barometric sensor connected to an Arduino microcontroller. The sensor captures humidity, temperature, and pressure. However, with a simple formula, it also calculates the altitude of a given place, considering that atmospheric pressure decreases with increasing elevation.

With the data collected, the next step was to create a device that embodied the idea of linking two places. I developed a simulation in Processing software, using the Box2D library, a physics engine library. This same simulation (hosted on a Raspberry Pi board), controls an Arduino UNO microcontroller which, in turn, controls the movement of the servomotors. Every servomotor is connected by an elastic cord, with a drawing object in the middle. Their movement is controlled by one of the data stated above (temperature, pressure, altitude). Pivot forces pull the pencil in opposite and unpredictable directions, creating unique marks on the canvas.
How to Measure a Planet:
Collect data in situ, from a given place.
Write a software and let it process your collected data into a physics simulation.
Use the collected data and mix it with analogous data from elsewhere (wind, rain, geomagnetism, etc.) obtained with the help of a measuring-drawing machine.
As a result, an imaginary topography of two given locations is drawn.


Drawings / Imaginary topographies
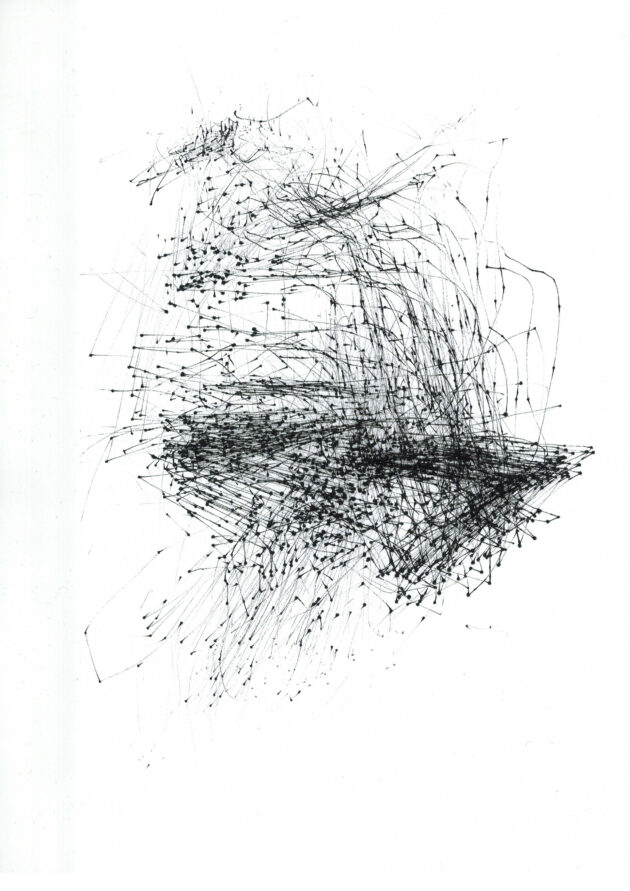
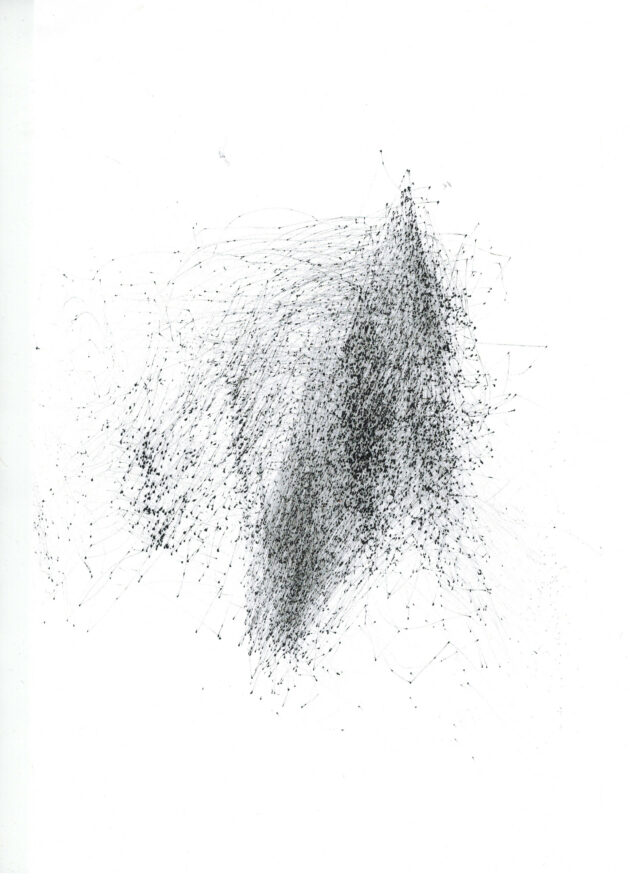
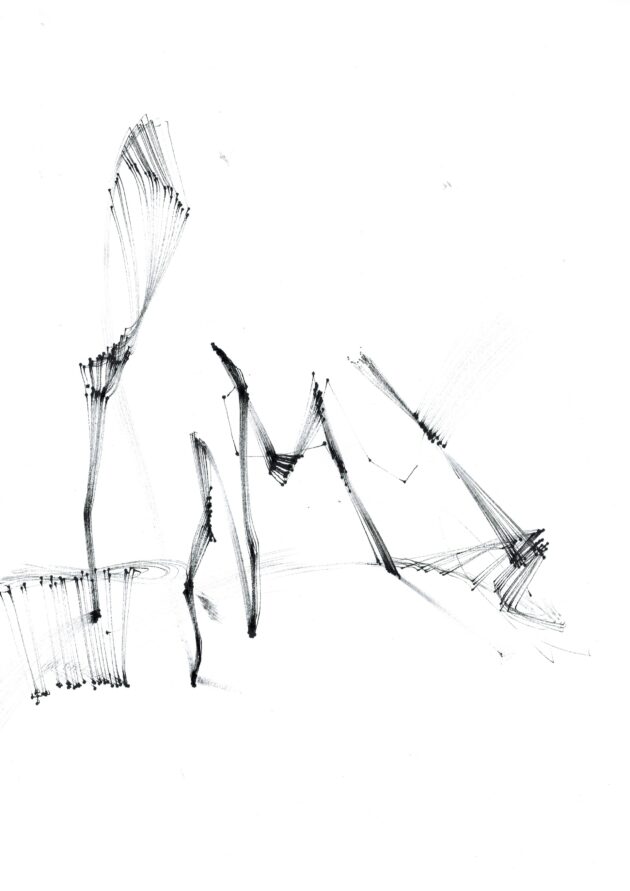
The drawings above were all drawn by the machine. Some in a couple of hours and some in the course of a couple of minutes. The data the machine works with is always the same, in this case, the data related to the height of the Laufenburg area in Switzerland. Nevertheless, every time the machine runs, factors related to its set-up change every time the starting point and, in turn, the way in which each arm of the machine pulls the elastics. This also influences how these physical forces interact with the drawing pencil and thus, the final result.
References
1944 Think like a Mountain. Aldo Leopold (book)
2007 What is an Aesthetic Apparatus? Jean-Louis Déotte (book)
2020 The Cordillera of Dreams. Patricio Guzmán (documentary)
Open Source Code
Processing simulation and Arduino code for Hochschultage 2022 version