A Messenger Map

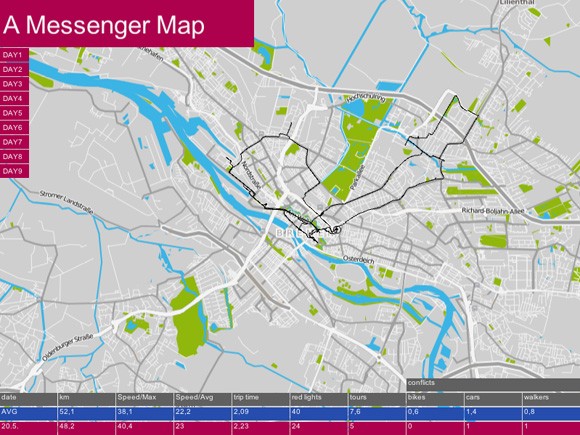
A Messenger Map is a Visualization-Project i made at a course for Information-Visualization with the Topic “mapping you mapping me” at the University of Arts in Bremen.
I decided to track me while i ride my bicycle at my work as a bicycle-messenger. So i stated to collect informations GPS-data, speed, distance, red lights, and so on.
In my Visualization i want to show every unique five hours of work a day.
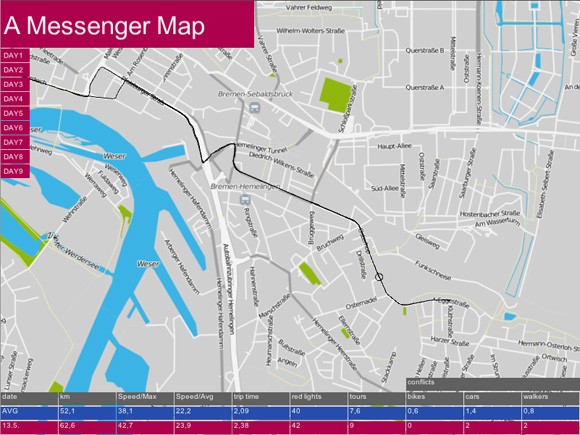
At the center of the screen you see the Map with the track and a ellipse which symbolizes me riding (but not in original speed ;) ).
At the bottom you see different categories of information i collect while i was riding. The blue numbers shows the average of all 9 tracks and the red numbers the information of the selected track.
[vimeo 26644622]


