The Annual Beer Report
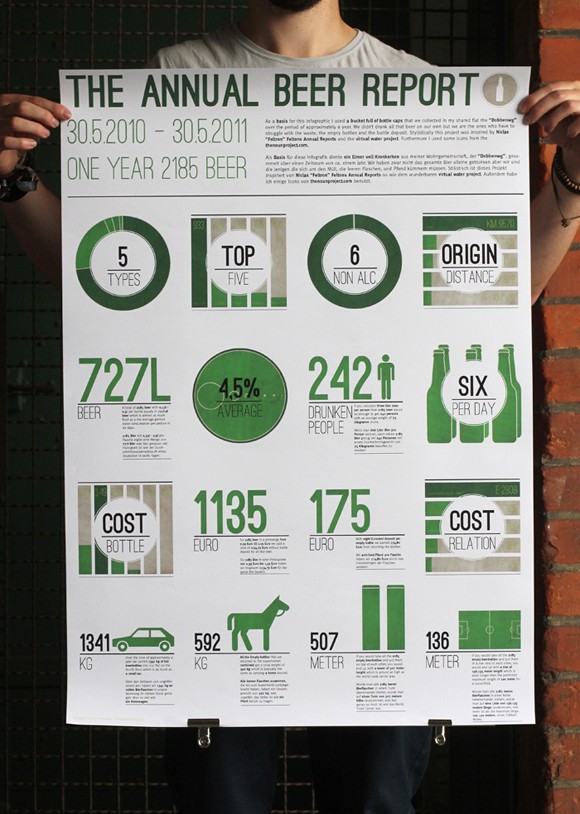
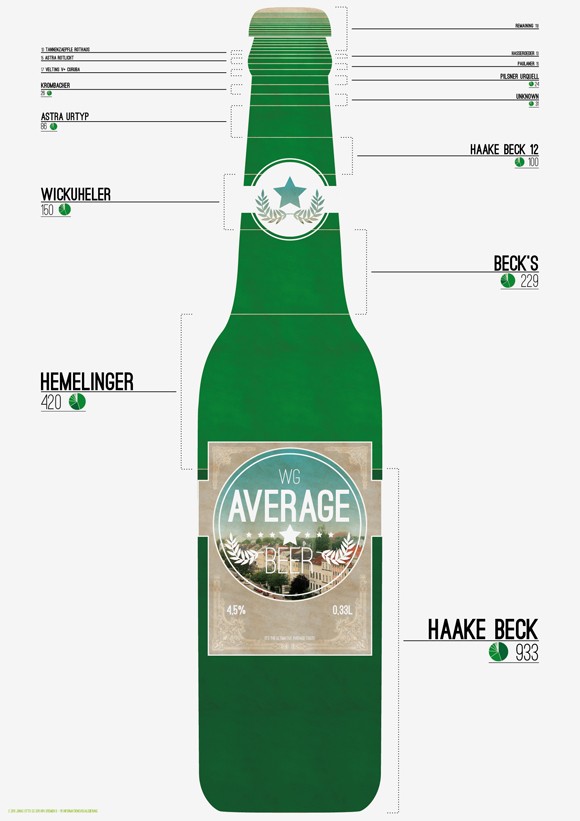
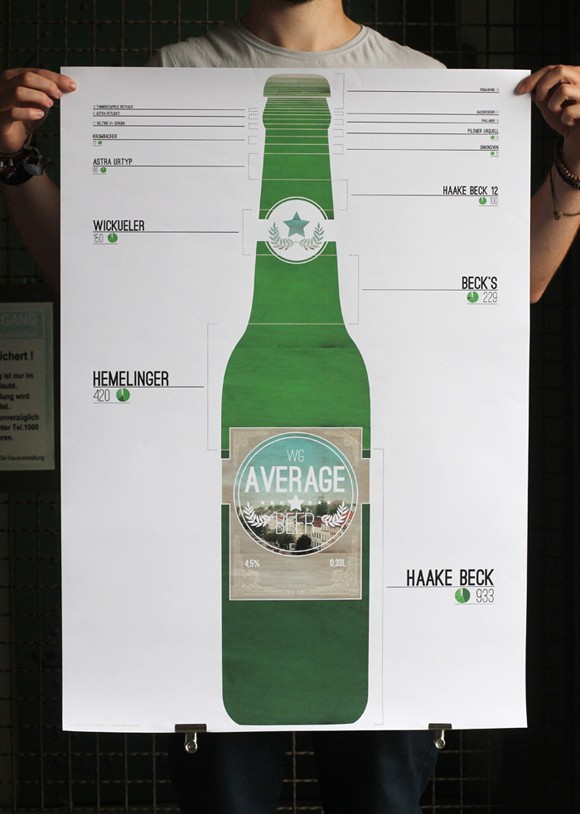
As a basis for this info graphic I used a bucket full of bottle caps that we collected in my shared flat the “Dobbenwg” over the period of approximately a year. The original idea of the bucket wasn’t to collect the bottle caps but keeping the floor clean during a party. While analyzing different data sets I realized that this bucket basically shows our average consumer behavior and further informations which in relation to known values makes aware of the extend of a consumption over a year. The second work combines the data from the bucket and shows them as an average composition-beer.
Stylistically this project was inspired by Niclas “Feltron” Feltons Annual Reports and the virtual water project. Furthermore I used some icons from the The Noun Projekt.